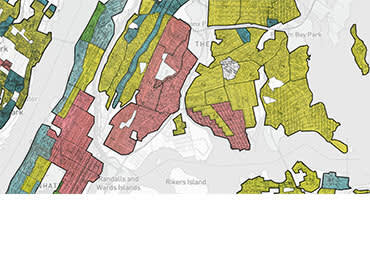
This mapping resource uses historical maps and data to visualize the historical practice of “redlining.” This process was implemented by the U.S. Government’s Home Owners’ Loan Corporation between 1935 and 1940 to identify areas considered “safe” for banks and other mortgage lenders and which ones were considered “hazardous.” This practice was often conducted on racially-motivated grounds, with majority-white areas being prioritized for investment and non-white areas disadvantaged in accessing financing. The effects of this racist practice are still felt to this day. Using historical data, this tool demonstrates which communities within select larger cities were prioritized and which communities were not.
Geographic coverage: City
